Is the stock you want to buy expensive or cheap?
InvestorIQ analyzes it with 14 metrics and gives you its quality IQ Score (0 to 100, letter A to AVOID). Free, in seconds.
No card needed · 7 days of Pro free
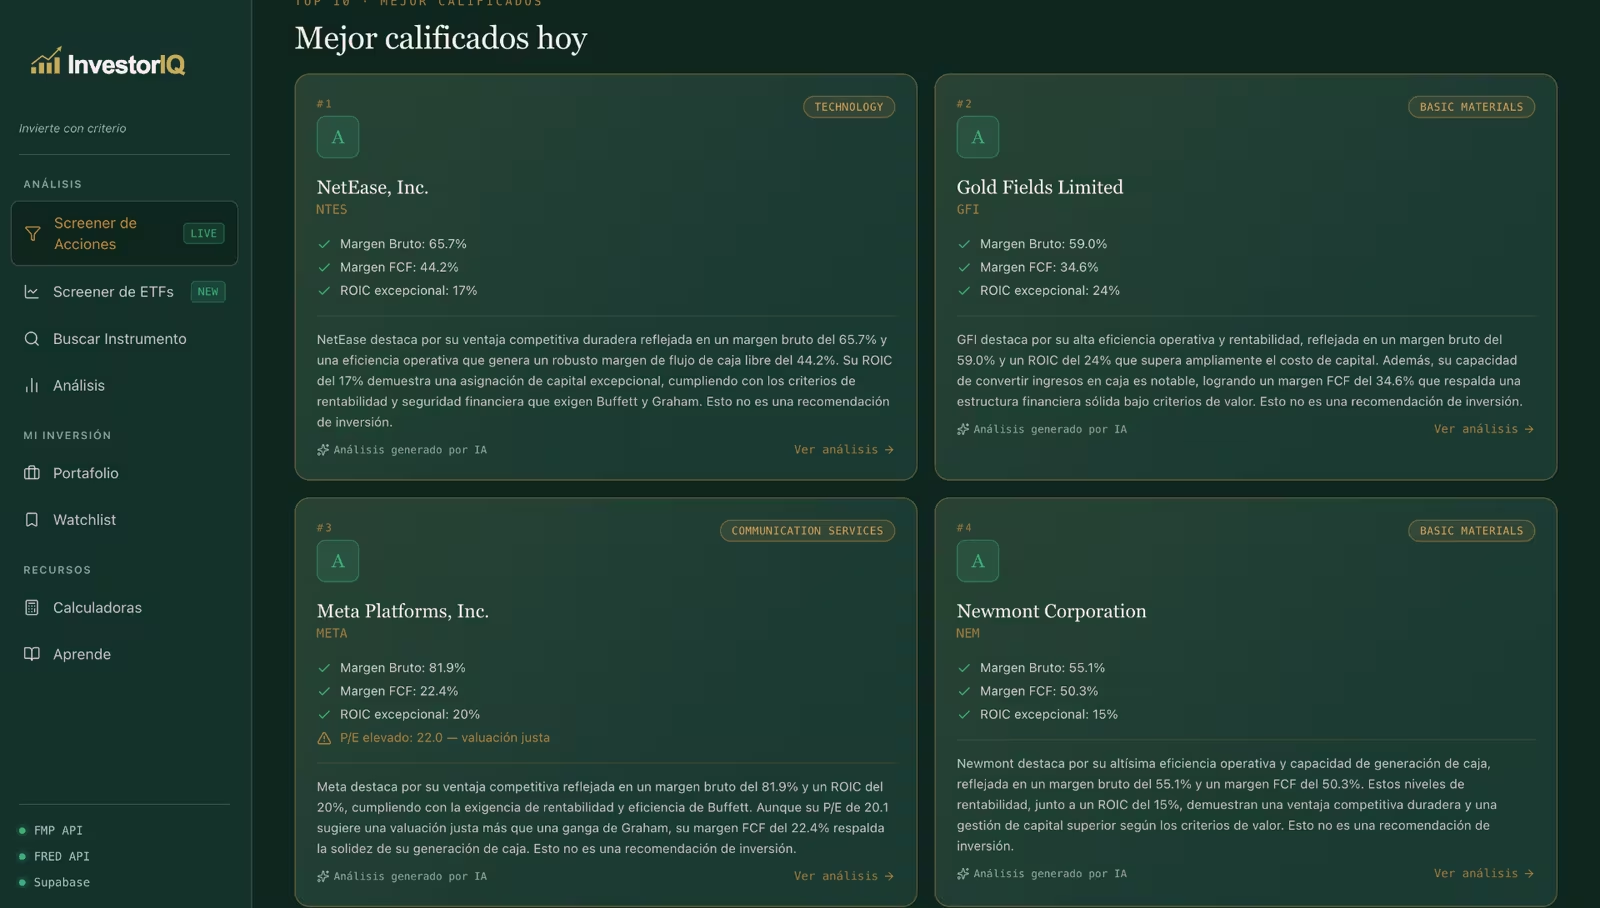
The strategy that beat the market for 50 years.
It's not a new gut feeling. It's the same fundamental analysis framework Buffett and Graham have applied for half a century — now automated and in Spanish.
Historical performance of Graham-and-Doddsville value investors (Buffett, 1984). Not a forecast of your results.
— Warren Buffett, 1984
From the Buffett · Graham framework, applied automatically to every company.
NYSE and NASDAQ stocks analyzed to the same standard. International markets coming soon.
Investing without analysis is gambling.
- You buy on rumors, TikTok or Twitter
- You don't know if the company actually makes money
- You lose 6+ hours hunting for data across 10 sites
- You decide out of nervousness, not data
- The market feels like a casino
- Automatic fundamental analysis in seconds
- 14 metrics reveal the company's real health
- Everything in one place, in Spanish
- You invest with judgment, not gut feelings
- A clear answer: Candidate, Investigate or Avoid
Everything you need to invest with judgment.
8 dimensions on 1 screen.
Safety, profitability, cash flow, valuation and more. 14 metrics and 5 sections that reveal a company's real health — without opening a single spreadsheet.
Like having a personal analyst.
Every analysis includes a plain-language explanation generated from your metrics — without inventing data.
"With an ROE of 43.8% above the sector average, GFI shows exceptional capital efficiency…"
A company's quality expressed as a number from 0 to 100, sealed and auditable.
Expensive or cheap? Buy price, intrinsic value, forward P/E, PEG and Rule of 40.
Filter nearly 500 NYSE/NASDAQ stocks by Buffett·Graham standards in seconds.
Over 40 ETFs with 12 proprietary metrics.
Compare up to 4 stocks side by side, multiples included.
Sync positions via broker: over 20 available.
Get notified if a position deteriorates or hits its Graham buy price.
Alerts when an IQ Score changes.
Which profile your portfolio resembles, where it's unbalanced, and how to fix it.
Answer 5 questions and build a model portfolio for your risk profile.
All your amounts in your currency, with one tap.
What matters in your portfolio, every week.
A clear verdict. Not a data dashboard.
Others bury you in numbers. InvestorIQ interprets them and answers the only question that matters: what should I do with this company?
A solid company at an attractive price. Fundamentals and valuation line up.
Good company, expensive price. Worth watching and acting when the price drops.
Risks in the fundamentals or clear overvaluation. Doesn't meet the standards.
From zero to a decision in 3 steps.
Enter the ticker
AAPL, MSFT, TSLA… type the symbol or the name.
Wait a few seconds
14 metrics are analyzed automatically with the Buffett + Graham framework.
Get your verdict
Candidate, Investigate or Avoid — with the narrative explaining why.
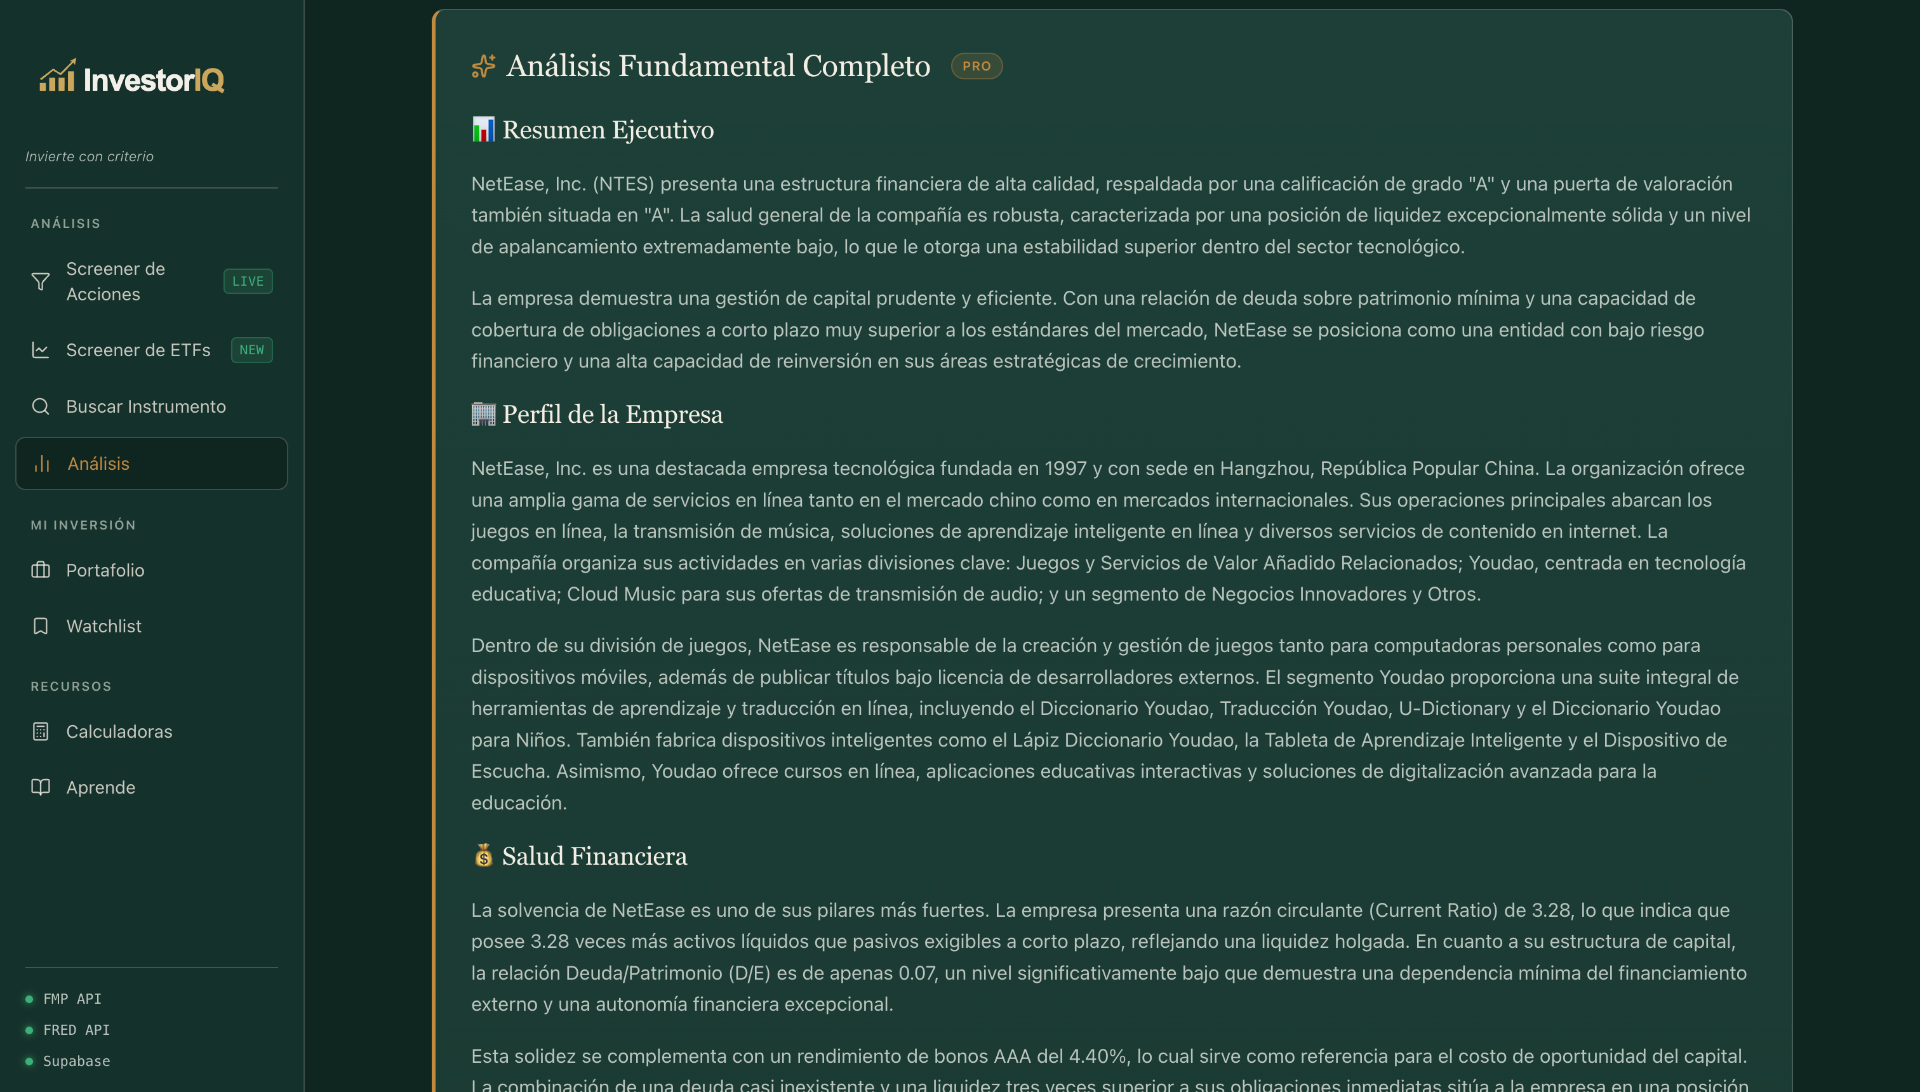
Complete fundamental analysis, on one coherent screen.
- AI narrative generated from your metrics (no invented data)
- 5 sections: executive, profile, health, profitability and risks
- Real-time news context (last 2 weeks)
- Comparisons vs. sector benchmarks
"With an ROE of 43.8% above the sector average, GFI shows exceptional capital efficiency. Its Current Ratio of 1.75 and D/E of 0.43 confirm a solid financial structure…"
What used to take hours of research across multiple sites now lives on a single screen — accurate and in Spanish.
Start free. Scale whenever you want.
No credit card. No contracts. Cancel anytime.
- Unlimited analyses with IQ Score
- AI narrative on every analysis
- Graham valuation and forward multiples
- Portfolio with connected broker
- Quality alerts and unlimited watchlist
- Diversification diagnosis and investment plan
- Comparator for up to 4 stocks
- View in pesos (MXN) and weekly email summary
No card · No contracts
- Everything in Free, unlimited
- IQ Score, Graham valuation and forward multiples
- AI narrative on every analysis
- Portfolio with connected broker and quality alerts
- Diversification diagnosis and investment plan
- Comparator, MXN view and weekly summary
- Priority support
Cancel anytime
It renews every year at the same price while your subscription stays active.
Free plan after the trial: top 10 screener, 1 analysis/month, portfolio up to 3 positions, watchlist up to 5 instruments, and calculators.
The best time to invest well was yesterday. The second best is today.
Join investors who already analyze with judgment, not gut feelings.
No card · 7 days of Pro free · No contracts